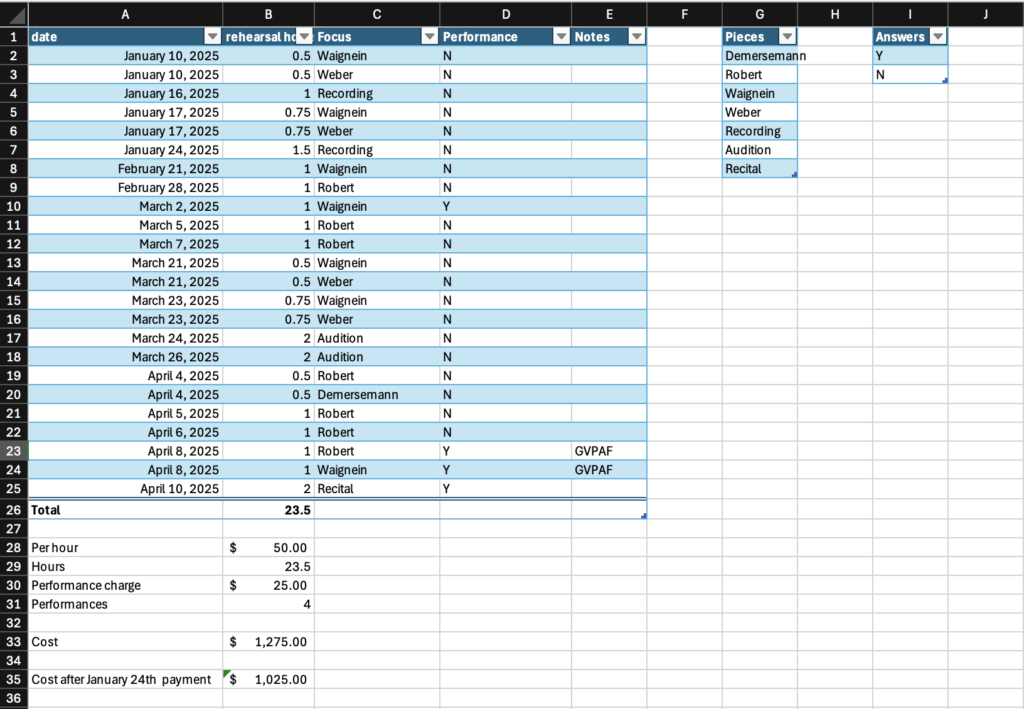
Since my previous initiation into Excel, my main goal has been to get it working properly and finish my hours and billing tracking table for the pianist I work with. Since it went unmentioned in my first blog, I’m a music performance major in Classical saxophone, and I hire a pianist to join me for pieces for saxophone and piano, which is usually about half of my repertoire, since my pieces are too demanding for the student accompanists other performers work with. Moving on, the troubleshooting issues made me realize the integration of Microsoft Excel with my Macbook operating system was a bit clunky, so I took a detour to recreate the table in Apple Numbers to compare the experiences on each platform. Below is the completed hours tracking sheet in Microsoft Excel:
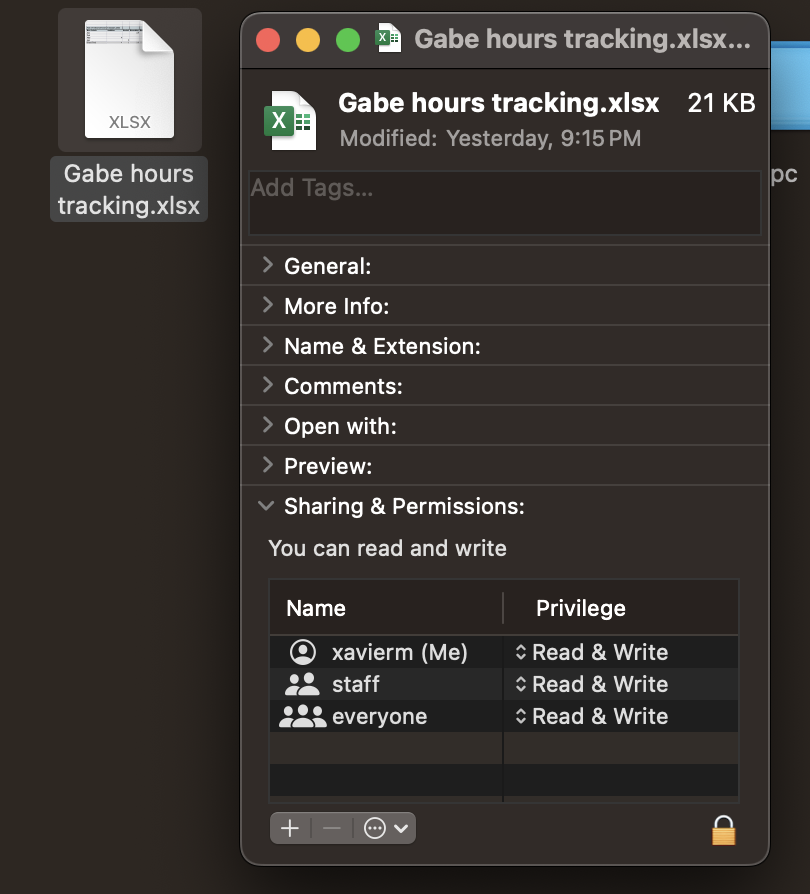
First off- saving and file access problems. Last time, Excel insisted that the files I created were read only and kept prompting me to make new copies, which would also be read only, giving me an endless cycle of file copying that occasionally deleted progress anyway. The solution to this problem was not intuitive, to say the least. First, I had to find the file in the MacOS Finder app, which, for some reason, wasn’t possible with regular menu navigation. The only way to bring up the file in Finder was to right click it in the Excel app home page and select “show in Finder”, which showed it inside a long tree of nested folders topped by a greyed out Library folder that was hidden when Finder was opened normally. In order to allow me to edit the file, I had to select get info > sharing and permissions > set to read and write for the “staff” and “everyone” roles. I will mention that xavierm (Me), which is me, was already set to read and write, and I remain unclear on why this needed to be done, but sometimes we must accept things and move on. Often, when older people use computers, they attempt actions that seem to us youthful people to be entirely unreasonable, clicking random buttons that we have no idea why they would expect to do anything. I now fully understand this, since the solutions that actually do work are also so unreasonable that I often feel there’s no reason to use sense at all, really.
Having solved this issue, I continued working on my tracking sheet. I had two issues I wanted to solve as mentioned in the previous blog:
- “Waignein and Weber” being separate categories from “Waignein” and “Weber” for the purposes of counting hours spent on each piece, and
- incorporating the first hour of performances being billed at $75 instead of $50 in the sheet’s automated cost calculations.
The first of these problems, the rehearsal focus labeling, I opted simply not to solve. A rehearsal with a combined focus would be split into two rows each counted at half of the duration and each with their own focus. This prevents potential doublecounting and makes the whole operation a lot simpler. I also added a dropdown menu to this row for easier entry by using the Data Validation feature.
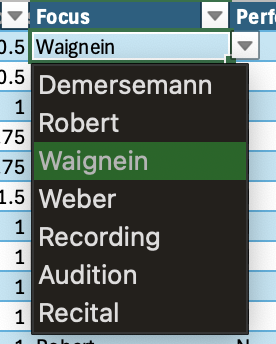
When you have a set list of possible values that can be added into a column of cells, it’s convenient to make a dropdown list both to save the trouble of typing things in every time and to prevent you from creating a new category every time you spell something wrong or capitalize something differently. This Microsoft Support tutorial for making them is straightforward and simple to follow. The process requires you to make a reference table with the possible values to select in the Data Validation window. I placed my reference tables beside my tracking table, but for larger sheets with greater complexity, it can be better to move them to a separate sheet.
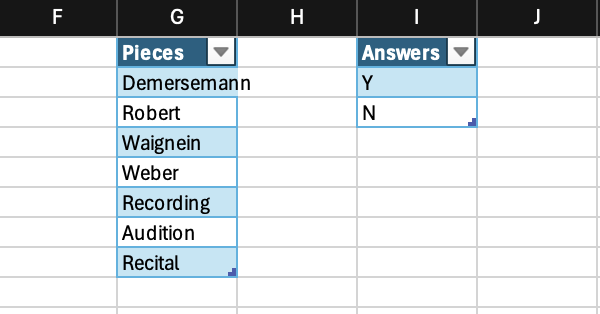
As for the incorporation of the $75 first hour of public performances, I realized that this was equivalent to adding $25 to every session that was considered a performance, since the normal hourly rate is $50. I used the same Data Validation feature to add a Y/N performance column, and used the COUNTIF function, =COUNTIF(Table1[Performance], “Y”), to show the number of cells within that range that I counted as performances. I could then multiply that number by 25 and add it to the total.
![An Excel spreadsheet showing a cell containing =COUNTIF(Table1[Performance], "Y") with a column labeled Performance containing Y/N responses highlighted.](https://edci136--xmarican.opened.ca/wp-content/uploads/sites/9158/2025/04/image-9-1024x998.png)
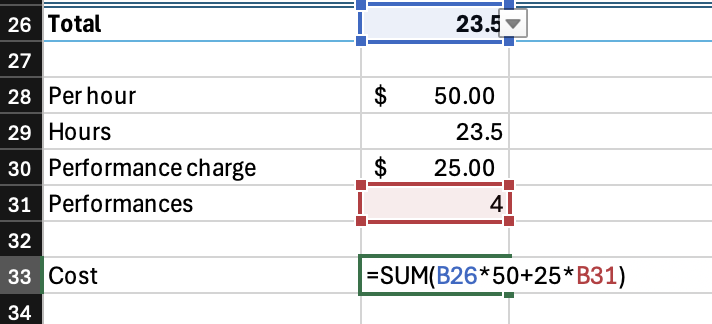
To determine the total cost, I used a straightforward SUM feature: =SUM(B26*50+25*B31). This function adds the number of hours multiplied by the hourly rate to the number of performances multiplied by the performance charge, giving me a total cost that factors in the hourly rate and the $75 charge for hour one of performances. The total cost since January came out to $1,275.00. This is why I don’t buy textbooks for my classes. The profs always tell you you need to but you almost always don’t.
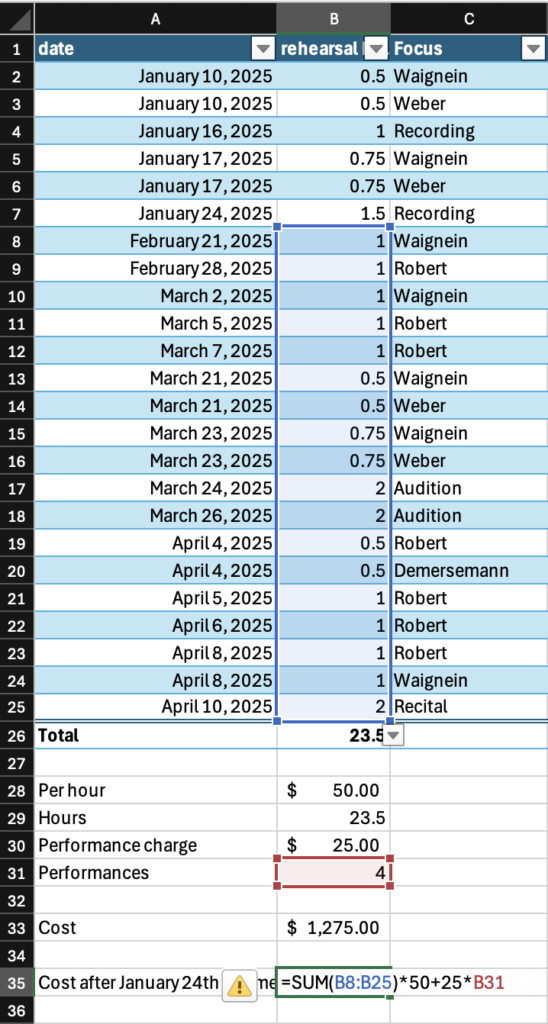
I had most recently paid my accompanist on January 24th, so to determine what I still owed, I added another cell with a similar SUM function to the one above, replacing the total hours since January 1st, B26, with B8:B25, the range of dates after January 24th, using the following function: =SUM(B8:B25*50+25*B31). Interestingly, this gave me $2,725.00, which doesn’t sound quite right. When I moved the bracket to create the function =SUM(B8:B25)*50+25*B31, it showed the correct figure, $1,025.00. I initially thought that this meant you need to surround your ranges in brackets, but the function =SUM((B8:B25)*50+25*B31) also shows $2,725.00. For some reason, adding a close bracket to the end of the function, regardless of where other brackets are placed, groups together (50+25*B31), breaking the normal order of operations you would normally use when doing algebra and multiplying B8:B25 by 75 by B31. This perplexes me, but, as with many things, one can only move on.
As I mentioned, the troubleshooting I needed to do to get Excel working made me curious about the native spreadsheet program for MacOS, Apple Numbers. Numbers is ultimately a shoddy competitor to Excel, purely due its propreitary device locking making it much less universal, transferrable, or shareable, so I don’t intend on getting more experience with it going forward, but I thought recreating the hours tracking table in Numbers would be a good way to get more context for the strengths and weaknesses of Excel specifically, not just spreadsheets in general. As I suspected, I saw no barriers from permissions issues or OS navigation to create and access the file. The result can be found below:
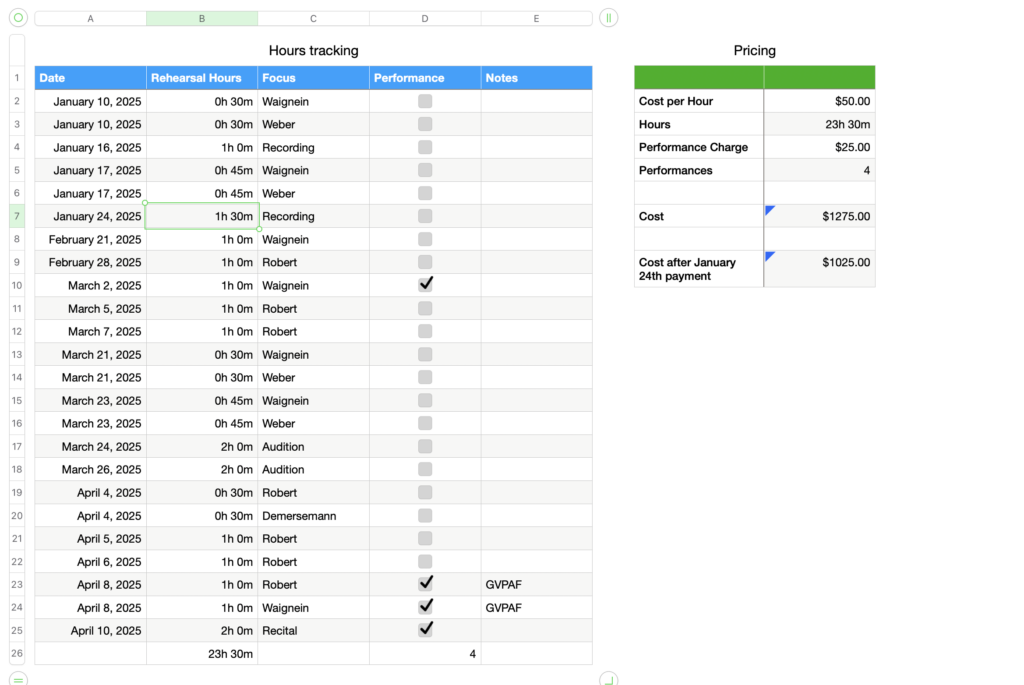
The difference in design language is the most apparent factor, with Apple presenting a much more streamlined sheet with things looking a little more plain and having larger and more separated text by default. I do prefer the more open layout, and I may increase the row height and text size in Excel going forward to borrow some of the improved readability. The column headings are also mobile, staying at the top of your screen as you scroll down in the table so that they stay visible, which I do appreciate. The cell overflow response is also far superior here. In Excel, if you type text longer than the cell, it bleeds over into the next cell and then cuts off at the edge of the cell when you click away. In Numbers, the text continues on a lower line as one would expect in any text box. This makes it much easier to design better looking tables without constantly readjusting the column width every time you type a longer phrase than normal. The most apparent functional difference is that Numbers opens straight into a table and does not give you the same endless grid of cells that Excel bases itself on. This isn’t a huge limitation, you can still open extra tables or extra sheets for blank space, but this does lend the program a sense of inflexibility compared to Excel, where you can input your data wherever you want and then impose a table structure onto it automatically after the fact.
Numbers offers more ways to represent data. As you might notice, Numbers allows you to format cells as checkboxes, which feels a bit more graceful than my Y/N dropdown menu I used for the Performance tab in Excel. Numbers also allows you to format cells as durations. In Excel, there is no option to format a cell to represent hours and minutes, you must always convert the fraction of 60 into a decimal. Numbers allows you to enter numbers as decimals or x:xx formats and will format them into xh xxm notation automatically when the Data Format menu on the right side of the screen is set to durations and its further specifications. Hours tracking has been my main use of Excel in the past and I have always wanted this, it’s so much more satifsying and occasionally less confusing to write 15 minutes instead of 0.25.
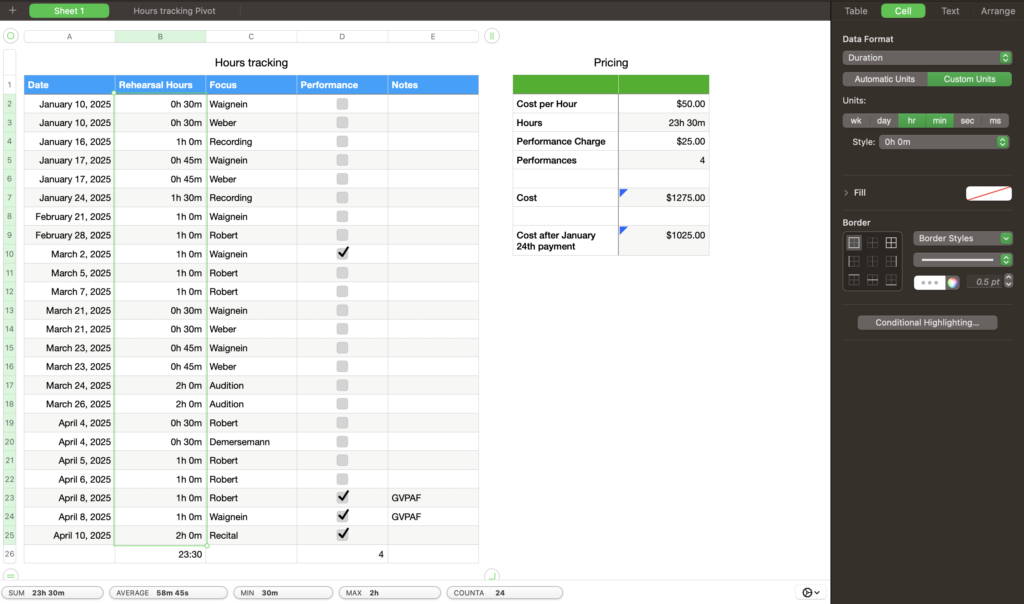
On the flip side, there is some unwanted inflexibility here. A cell feeding from a totalling cell in duration format can only itself be set to duration format. I tried to set the Hours total on the pricing table, which feeds from Hours Tracking B26, to number format, since, knowing it’s going to be fed into another equation, it’s nice to be able to see it as a decimal, but the input didn’t do anything. This led me down a bit of a rabbit hole trying to figure out how to get the system to allow you to change the cell format from durations when referencing a total of hours and minutes.

Above is the SUM feature determining the total cost of accompaniment since January on the Pricing table using essentially the same equation as the Excel sheet. In this case, the system does allow you to change the cell format to currency, so I knew feeding from a duration total didn’t make it impossible to change the format. I experimented with adding 0 or multiplying and dividing by the same number in a SUM function for the Pricing table Hours total cell, but nothing seemed to let me change the format. After additional experimentation, I began to find strange arbitrary combinations of equations, cell references, and bracket placements that either did or did not allow the cell format to be changed, which I intended to document here, but after closing and reopening Numbers after a break, I found it was all a glitch. As long as you get the SUM function to do something, like adding 0, it does allow you to change the format, and all of that time I spent experimenting could have been a dream for all I know.
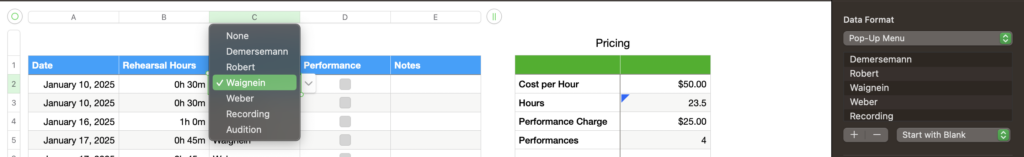
I’ll also note a difference in the dropdown menu functions of each program. Excel requires you to build a table of responses somewhere in the workbook for your drop down menu to reference, but in Numbers, you can simply select “Pop-Up Menu” in the Data Format menu and add your list from there. I found this to be the much more elegant and intuitive solution. The Pop-Up Menu does prevent you from typing manually at all in the cells formatted to it though, you can only bring up the menu and select from the list. In Excel cells with drop-down menus, you still can type, with the system automatically autofilling from the first couple of letters of something on the list and simply rejecting your input if you type something not on the list. This is a less consequential but widely representative example of how Numbers streamlines processes while making the system feel less flexible, even when the material difference is negligible.
The final item I want to call attention to is Pivot tables. Here, you can find a more detailed explanation of the concept, but they are essentially a tool that automatically reorganizes data on a table in another sheet to make it easier to analyze various aspects of it. Excel and Numbers both have pivot tables and they work almost entirely identically, but Numbers has the small problem of getting the figures wrong.

Above, you can see the pivot table that Numbers generated for the Hours tracking table, with Dates as rows and Rehearsal Hours as values. You might notice a Grand Total of 25 hours, which is an hour and a half more than the total on the table it’s pulling the data from. One of these mysterious extra hours comes from (blank), though I have no idea what that could be referring to. I was also able to determine that another extra hour was added to January, specifically showing 2 hours on January 10th, directly contradicting the table. Correcting for these errors, however, leaves us short at 23 total hours. I don’t have the slightest idea of where this discrepency comes from, but Apple markets this program as an accounting tool, so the fact that it misrepresents its own data is positively unacceptable. If this were a bigger dataset where these issues were less noticeable, this could have serious consequences for a business. This kind of error being possible makes the pivot table feature impossible to trust, which makes it completely useless.
Overall, Apple Numbers was the easier platform to pick up, though the fact that I already learned the same skills in Excel likely helped. I only needed to consult external sources twice, to find the Pop-Up menu option and to figure out how to use the COUNTIF function on the checklist, and I likely could have figured out both on my own if I was slightly more persistent. On Excel, I needed a tutorial for basically everything. In the end, however, Excel does remain the better program overall, allowing for greater flexibility and forgoing some streamlining to keep you more firmly in the drivers seat. The Excel pivot tables are also accurate.
Something that was particularly striking for me was how the central difference in presentation, Numbers with tables and Excel with their open grid, made the idea of converting files from one system to the other fundamentally impossible to do smoothly. Many of the unique input and representation features on Numbers, like the checklists, star ratings, and duration formats, seem almost deliberately designed to make Numbers files unconvertible into Excel files. Compare to Google Docs and Microsoft Word, which are not nearly as divergent, Docs being able to export directly into .docx files with relatively minor impact. This to me suggests a certain intentionality of incompatibility on the part of these companies, showing how locked down to their platforms they want their users to be. For all of these differences, though, the formats offer the same core benifit of horizontal and vertical data storage that make spreadsheet programs desirable in the first place, and everything layered on top is really just icing on the cake.